
Follow

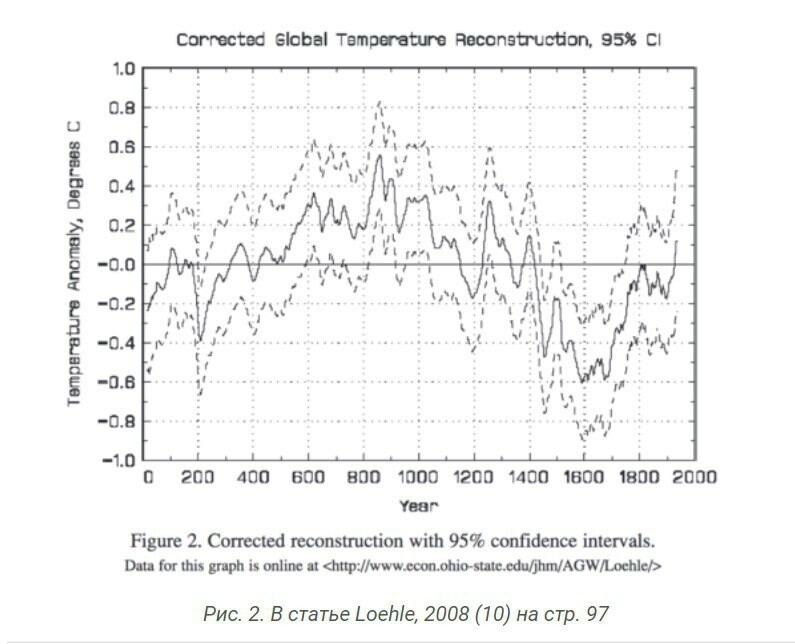
@mypidxaku Warming correlates strongly with life, growth, longer harvest seasons etc.
Cold correlates with deat, contraction and crisis.
The climate hysterics should learn this and return to life, instead of hating it.

@mypidxaku Warming correlates strongly with life, growth, longer harvest seasons etc.
Cold correlates with deat, contraction and crisis.
The climate hysterics should learn this and return to life, instead of hating it.