
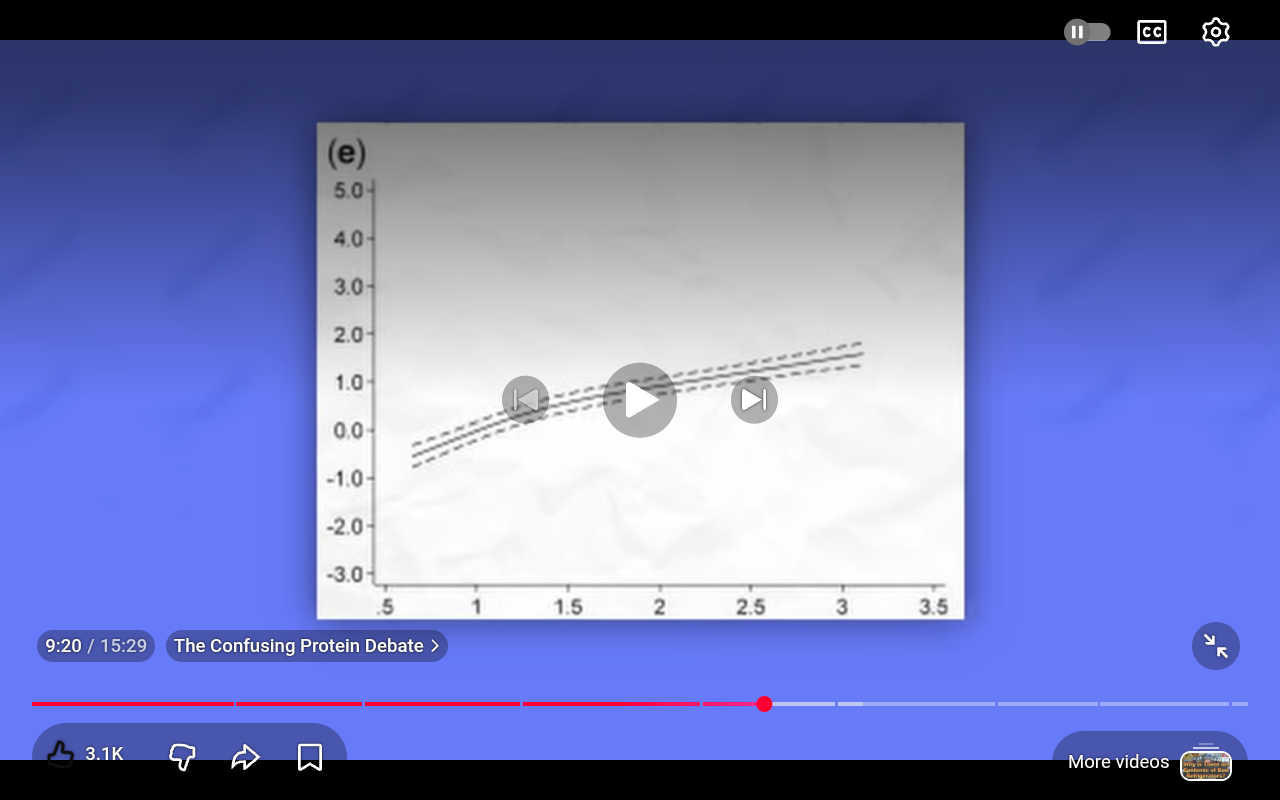
Can someone convert the graoh from the screenshot on the video in this link to a table with the y values for the middle line that go with x values that are multiples of 0.5 on the x axis please

Follow
There should be a attached screenshot from the video in the previous post you replied to
The image is not a prevuew image from the video but an attached screenshot
The URL or hyperlink is for the video
Do not need exact numbers, I just do not trust my eyes to get the right values by looking at the graph