Follow

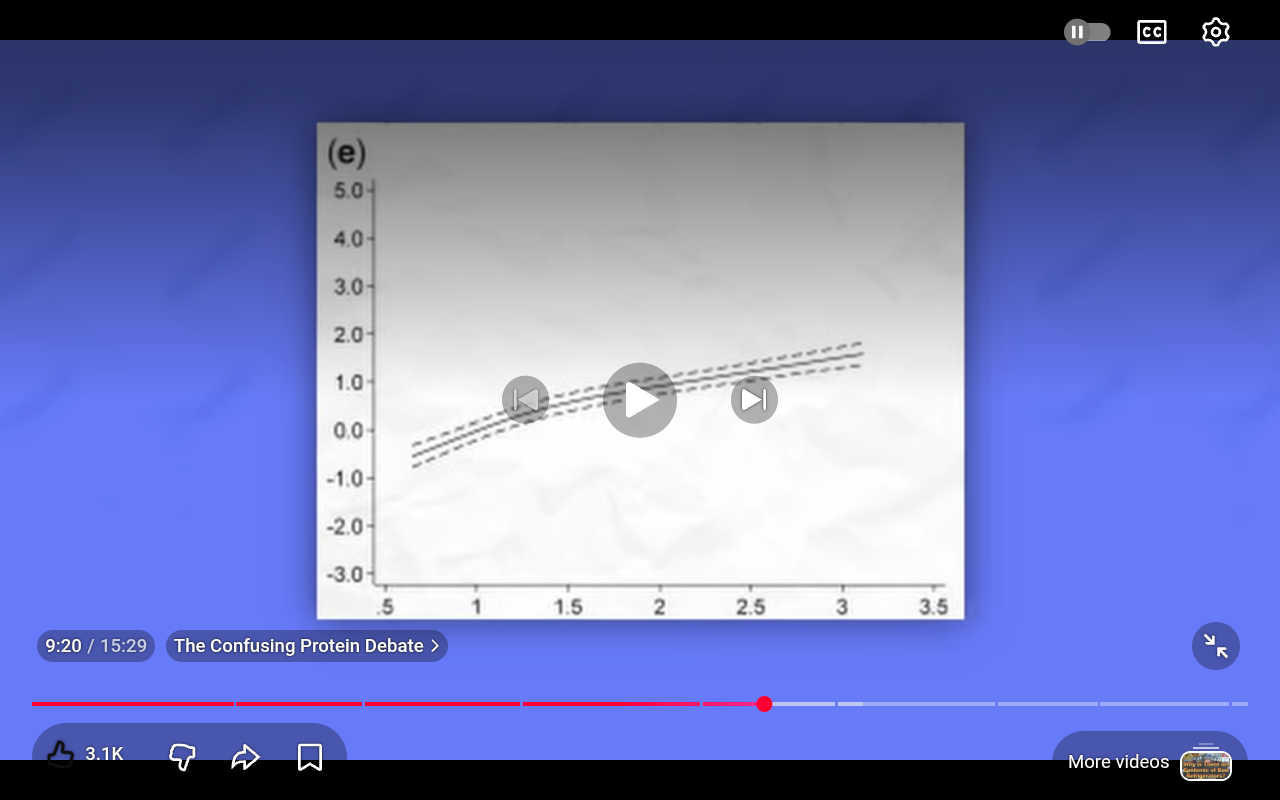
Can someone convert the graoh from the screenshot on the video in this link to a table with the y values for the middle line that go with x values that are multiples of 0.5 on the x axis please
There should be a attached screenshot from the video in the previous post you replied to
The image is not a prevuew image from the video but an attached screenshot
The URL or hyperlink is for the video
Do not need exact numbers, I just do not trust my eyes to get the right values by looking at the graph

Use a free online tool like PlotDigitizer (plotdigitizer.com) or GraphReader (graphreader.com):Upload the screenshot.
Calibrate the axes (select axis points and input known x/y values).
Select the "line" or "curve" extraction mode for the middle line.
Mark or auto-detect points along the line at approximate x = 0, 0.5, 1.0, etc.
Export the results as a CSV table.
Alternative with AI: Upload the screenshot to ChatGPT-4o, Claude, or Gemini and prompt: "Extract the y-values from the middle line of this graph at x multiples of 0.5, and output as a table."
If you can provide the screenshot (upload it here or share a direct image URL), I can analyze it directly and create the table for you!